After getting several queries on technical ‘tricks’, we decided to write down an article for all those who want free advice. Of course, when you need free advice, the expectation is that there has been a free things that you can work with.
Level: Beginner’s guide.
Note: The following article is for risk traders. Please understand that day trading and short term trading – weekly, F&O, swing trading – is not for all. Please connect with a SEBI RIA and get your financial risk assessed before jumping into trading. You can find SEBI RIAs at finvestor.in. Also, remember that day trading and F&O trading will affect the way you are taxed.
If you want detailed and extensive training, don’t miss Manjeet Vohra’s training, SEBI RIA.
There is no one success formula for trading. All traders and experts have their favourite technical indicators using which they believe that they can make money. We, in this article will about basic technical trading and you need to have a brokerage account to execute your trades. We would recommend Zerodha for trading since they charge Rs 20 per trade which is really good when it comes to day trading and F&O trades.
Basics:
Technical trading works on the following basic principles:
1. The market discounts everything. – Since the market already knows about the fundamentals of a company, the only thing can that vary are price movements based on demand.
2. Price moves in trends. – Trends are patterns that humans can read, follow and decipher.
3. History tends to repeat itself. – Price movements and indicators based on price and volume can repeat.
It is important to understand the above 3 main assumptions before we move ahead. In case you have an account with a brokerage firm, such as Zerodha, then the chances are you won’t need the free chart, since zerodha and other modern day low-cost brokerages provide unbelievable charts. But even if you have such charts, google finance is still a good light weight chart that can be used.
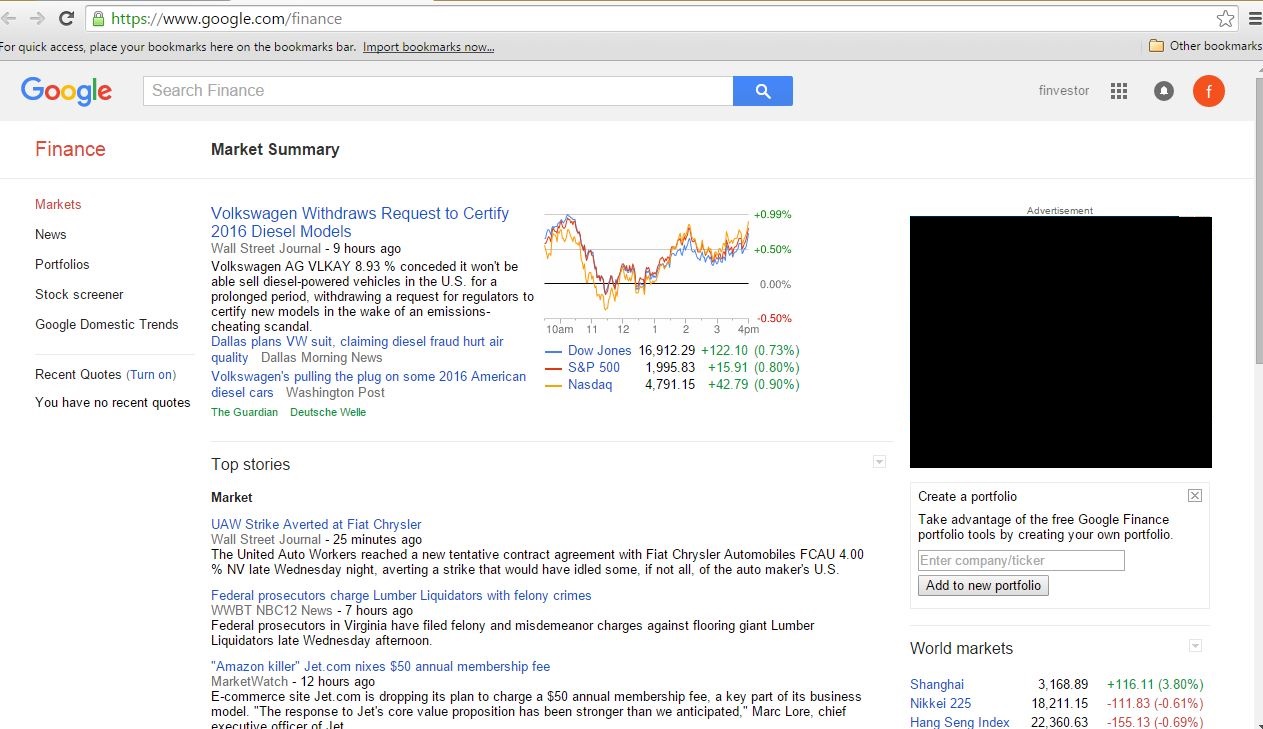
Let’s see how google finance can be an easily yet powerful tool to use. First type in google.com/finance. You shall see that by default it shows US market and also in the right bottom corner shows the market feeds from various other markets around the world. Some of the feed may not be live, but for us Indians, the feed is live and pretty quick.
To search for any stock you need to put in the following in the search box on top: Say we want to see the price of ICICI Bank. As you can the dropdown shows many stocks starting with ICICI, including ICICI bank and anything that has an ICICI attached to it. The advantage of google finance is that we can check the stocks of anywhere around the world. So if ICICI Bank ADR listed on the New York Stock Exchange has fallen down in the previous night, then we can expect some negative direction in ICICI in Indian stock exchange, (of course, unless there is any positive news from ICICI during Indian day time).
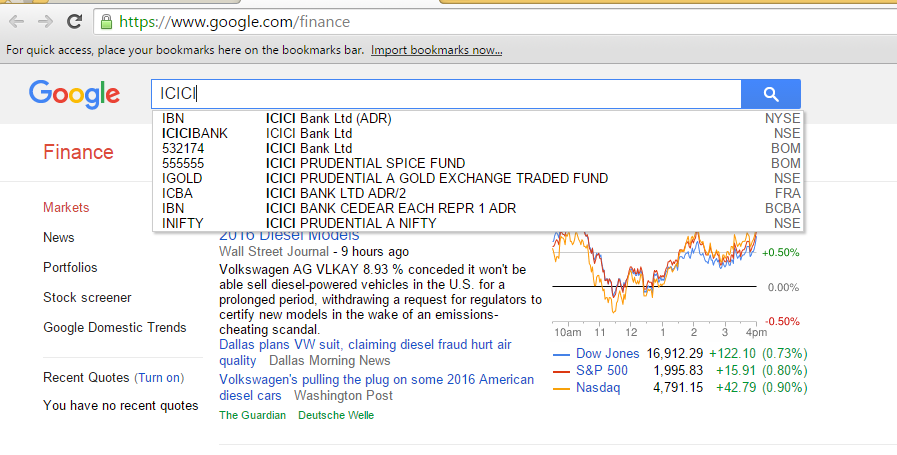
So what should a person do when she does only trading say on BSE or NSE. You need to type in NSE:<Stock Name> ie NSE:ICICI BANK. This would give ICICI Bank only for NSE and reduce your search time too.
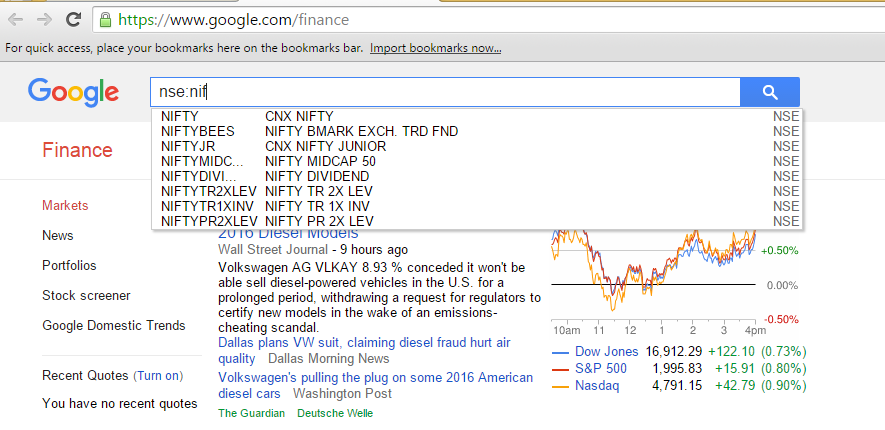
Now, the best part in google finance is that it shows indexes also. So if you want to trade on Nifty Index, which should be the only thing ideally you should do day trading, F&O on. Just type in NSE:nif and you see all the NIFTY listing! So you can choose CNX NIFTY for Nifty index and then you get the following screen
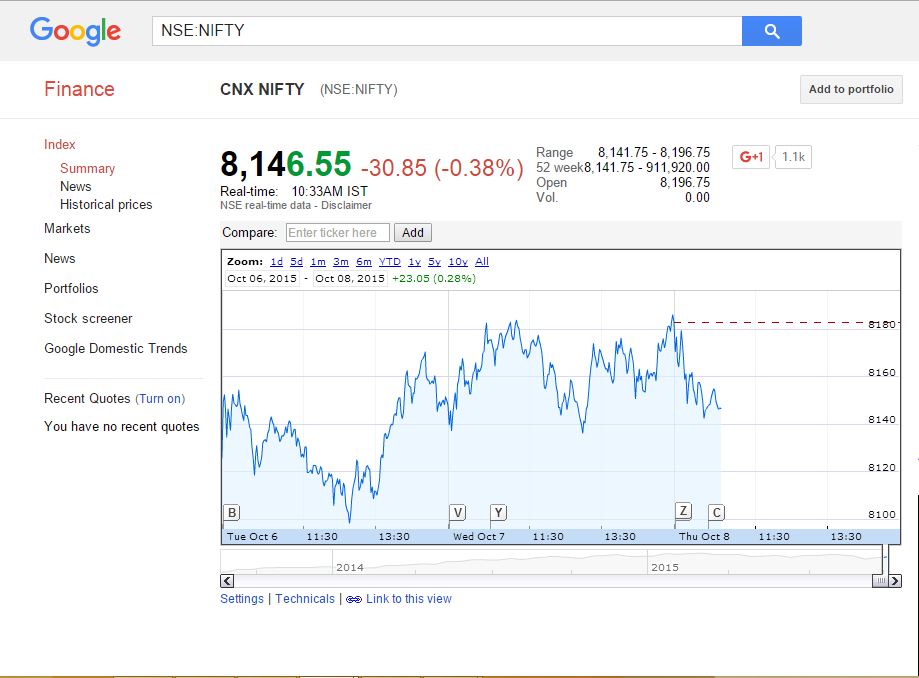
By default, google finance shows the line chart and it’s live. So no need to worry about any other chart.
As you can see the article is written on 8th Oct 2015 and the chart is also for 8th Oct 2015. So let’s see as a technical analyst what can we infer from the charts.
Advertisement
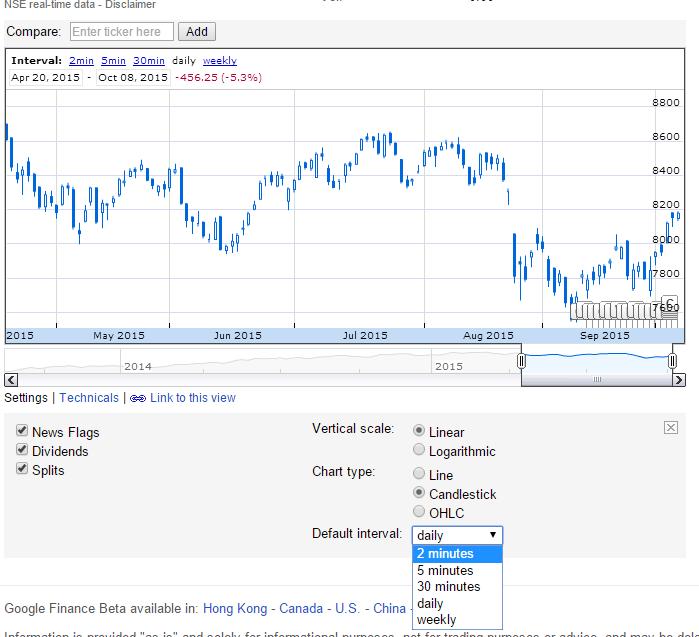
As a technical analyst, we need to bring in the three assumptions discussed in the beginning of this article. When it comes to charts, the assumption that price moves in a trend and that history repeats. So let’s see if we can infer anything from the chart. Actually, not much. Google finance does not provide any chart drawing or chart inference tools. There are other paid tools (such as if you join zerodha’s brokerage account), that help you draw inferences and patterns. But google chart does provide one useful tool – to see the chart as a 2 min, 5 min, 30 min interview and that too in candlesticks. This is a very basic, yet powerful tool. All you need to do is to go to settings below the chart and change Chart Type to candleSticks and default interval to 2 mins. Also uncheck the news flag, dividends and splits. That is not useful information and clogs the chart.
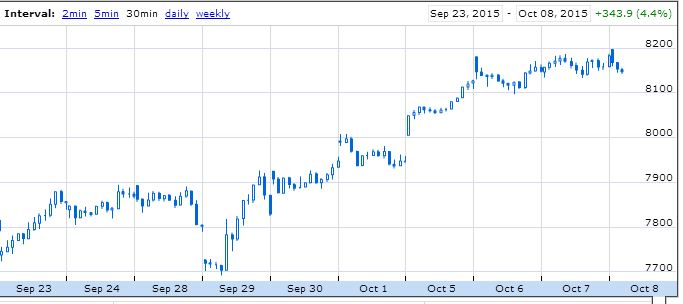
What this setting does is that you get a settings that gets updated live and updates the chart every 2 min with the candlestick pattern. It is very useful and in a click of a button we can move across 30 min and daily trends as seen in the image below. Flipping between is important to get the immediate support and resistance levels, ie the levels on which your target is assumed or an exit (stop loss) is to be triggered.
While there are many theories and logic for support and resistance, the simple ones are human eye level. Check the 30 min chart and see at which level did the chart rise or fall. ON 8th Oct 2015, the Nifty index has been rising for the last 7 days or so, it rose sharply from 8000 levels and currently at 8200 is kind of tired.
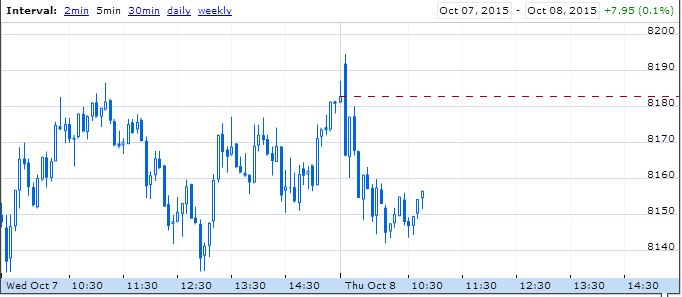
Putting in the 5 min chart, we get to see that the Index is kind of bouncing between 8140 levels and 8180 levels. This is not looking good, as there is no trend here. A trend can be defined as either upwards or downwards – ie the market is in a decisive upward movement or downward movement. Today, 8th Oct 2015, the market appears to be in a no trend zone. It is just bouncing up and down between very close levels.
Now, let’s take another feature of google fiannce, which will help us take a call in any market direction. Technicals, just click the techncials link below the chart. You shall see a lot of tehcnicals in the drop down. Google does not list all technical, but the ones listed are good enough to make a call.
Technical Indicators
The basic ones that you must have are
Bollinger bands – why? This includes the Simple moving average line by default! And yes, the upper bands and lower bands have a great significance in the direction of market.
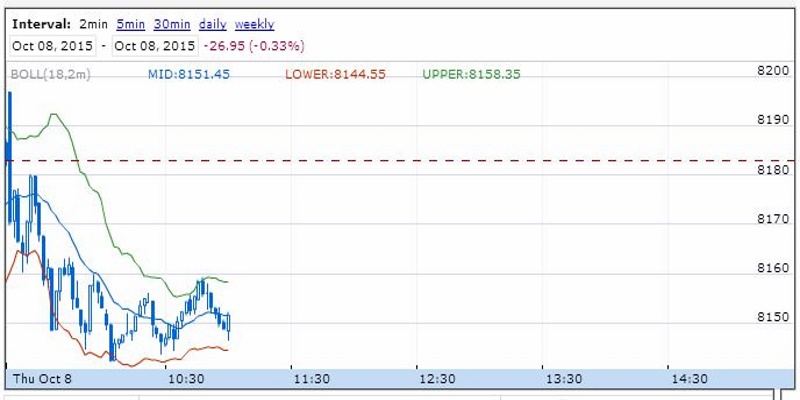
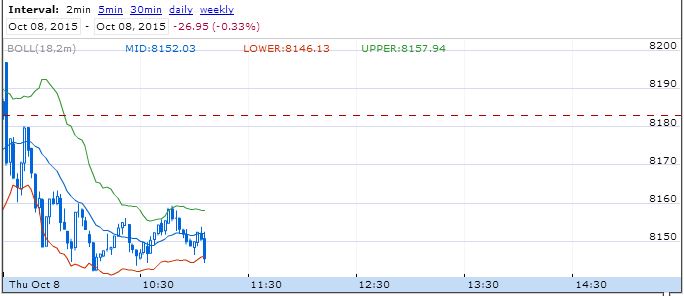
Go ahead and select Bollinger bands and you get the following screen. Change the time period to 18, this is what I like as shorter duration have lot of fluctuation.
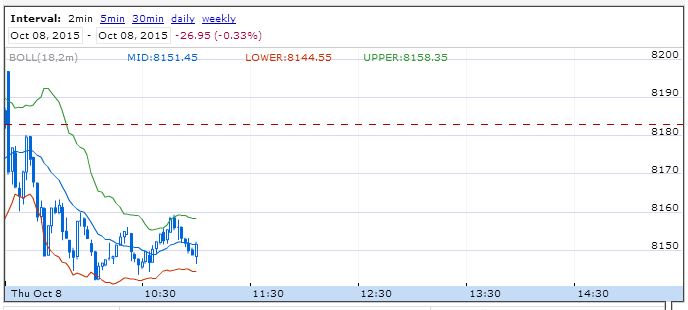
What is Bollinger bands? You can find the detailed explanation of the bands at <wiki link>, however to make things short and simple, it uses a simple moving average, ie average of last n prices (in our case n is 18 prices) and then uses a standard deviation of the last n (our case 18) prices to create upper and lower bands. The expectation is that the price movements are guided between the bands. Some traders sell when the price hits the upper bands, and buy when the price hits lower bands; while some traders believe that piercing the upper bands means higher prices are expected and piercing of lower bands means more downfall is expected.
Let’s see how Bollinger bands have responded today the 8th Oct 2015. It appears that when the prices have hit the lower bands, then the prices have also fallen down further. Observe the middle line – the simple moving average – a simple yet powerful indicator. This has shown that price in the opening time till 10:30 am have been below the average, which means downwards trend.
Let’s take another tool, which can be used to determine when to enter a market, especially when it is trading between levels. When a market is not showing either upward or downward trend, then it is a powerful tool for entry and exit points.- Slow Stochastic Oscillator (SSTO).
Go to Technical link again and click add, and then choose Slow Stochastic Oscillator (SSTO). Leave the time period unchanged, 14, 3 works fine for nifty!
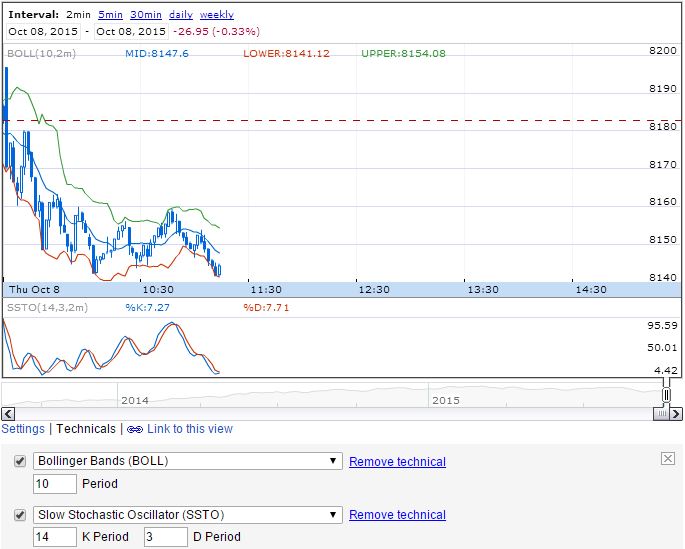
What this indicator does is that it keeps moving up and down and tells you when a market is oversold and when a market is overbought. This is used only when the market is just bouncing up and down, and not to be usedwhen there is strong uptrend or downtrend, esp in intra-day or short-term.
When the indictaor hits the bottom of the floor that’s the time to buy and when it hits the top of the roof (ie about 90%) then it is better to sell.
Combing the two trends. (actually three!)
All right so, let’s conclude the strategy for the day
Macro level: Global markets – Click google.com finance and see how Asian markets are faring, looks like most of them are down .5% to .8%, so the global sentiment is weak. There is nothing exciing around the world and hence, Indian markets will also be weak. Nothing exciting. So our markets may not fall down, but will be trading between a few levels and will be weak and perhaps see selling.
Levels of trade – The 30 min google chart will tell you the approx. levels. 8100 looks a point at which the markets bounced up and 8050 seems very strong support. On the upper side, the market has not been able to pierce above 8200 levels. Change to 5 min chart and you see markets bouncing between levels of 8130 to 8180.
Technical indicators: Since the market is trading between levels, the stochastic levels can be monitored – at 11:20 it is at the lows of the day, however before we make a call to make a buy look at the SMA, the prices are all trading below the SMA for much for the day, hence there is chance that the market may fall further and we may reach levels of 8100.
Therefore the strategy for today, is Sell nifty when the scholastic reached the overbought condition. Levels to watch out 8160 to initiate sell and also when scholastics reached upper limit. If any positive news comes into the market, then a buy should be initiated.

Hi – Can you please update this post? Looks like after Oct you have not made any more posts on this.
This is a very useful post and helps a lot in at least in basics
Hello Sameer,
Sure, we will try to make a “one week” dedicated only to trading to show how much of trading actually gives a positive return.
Thanks for your feedback.